Fund Details Help
The fund details page provides a comprehensive view of a fund across five tabs. This guide explains each tab and how to use the features available.
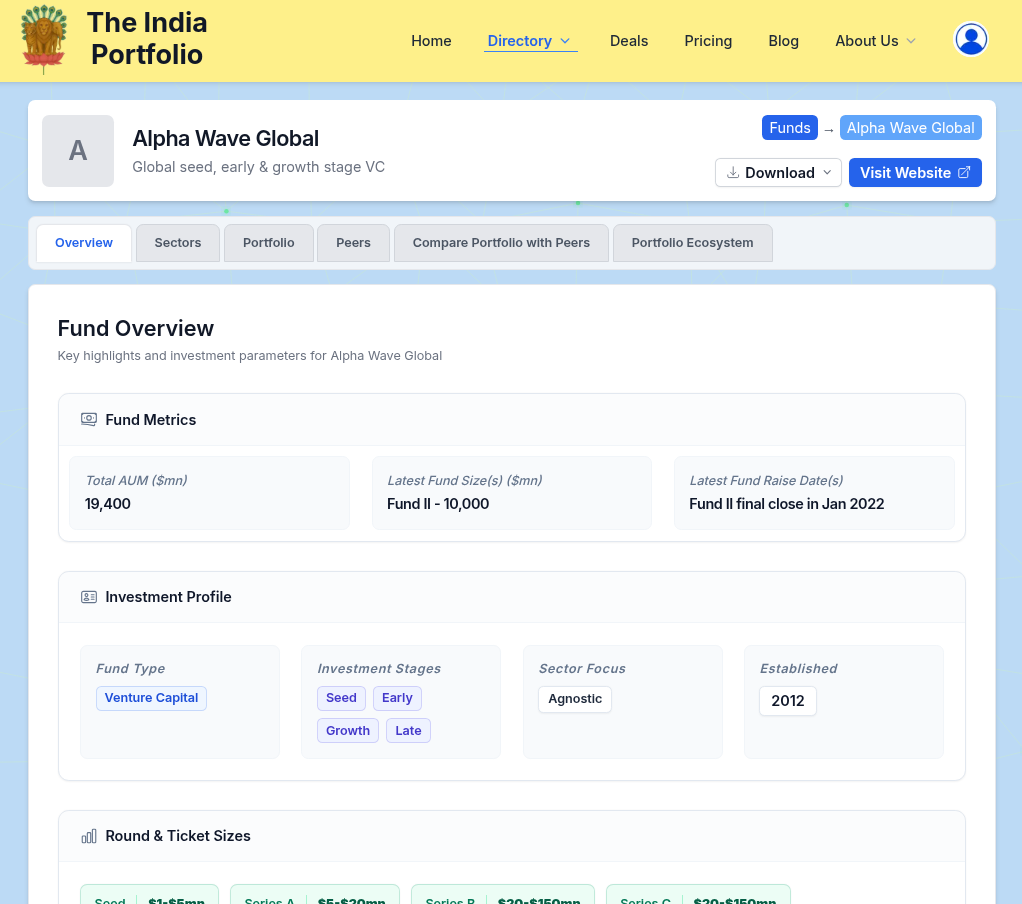
What information is shown on a fund details page?
The fund details page is organized into five tabs:
- Overview: Fund metrics (AUM, last fund size, last fund raise date), investment profile (fund type, stages, sector focus, established year, geography, investment strategy, actively investing status), and round & ticket sizes (Stage/Round with ticket size ranges).
- Sectors: A horizontal bar chart showing the fund's active Indian portfolio companies broken down by sector. This provides a quick visual summary of the fund's sector allocation and concentration. The chart shows each sector with a proportional bar and the count of companies, making it easy to identify which sectors the fund is most invested in.
- Portfolio: A sortable and filterable list of the fund's Indian portfolio companies, showing company name, sector, investment date, status (Active/Inactive/Exited), and website. For global funds, only Indian portfolio companies are shown.
- Compare Portfolio with Peers: A sector-by-sector comparison of the fund's portfolio composition against its peer group (funds with similar stages, ticket sizes, etc.). This helps you understand a fund's sectoral preferences, concentration, variations vs. peers, and contrarian styles. It also includes investment timeline charts showing new company investments year-by-year for both the fund and its peer group.
- Portfolio Ecosystem (Common Investors): A Kanban-style view showing other funds that have co-invested in the same portfolio companies. Funds are categorized as:
- Invested Before: Funds that invested in the common portfolio companies before your fund
- Same Stage (Syndicates): Funds that invested around the same time (co-investors, syndicates)
- Invested After: Funds that invested after your fund
Why do some funds have missing or incomplete data? Why does it say "N/A" or "Not relevant" for some fields?
Data is collected from public sources, fund websites, and industry news. For some funds, especially newer or less active ones, certain details may not be available or up to date. We strive to keep the information as accurate as possible.
"Not relevant" indicates that the metric may not apply to that particular fund type - for example:
- Fund size or fund raise dates may not apply to Sovereign Wealth Funds, DFIs, Angel Networks, or Corporate VCs
- Some Corporate VCs and others may not have an AUM concept
- The "Compare Portfolio with Peers" and "Portfolio Ecosystem" tabs are only available for equity funds (Venture Capital, Private Equity). For Venture Debt, Private Credit, or Secondaries funds, these tabs are hidden.
What does the "Sectors" tab show and how can I use it?
The Sectors tab provides a visual summary of the fund's active Indian portfolio companies broken down by sector. This tab helps you quickly understand:
- Sector Concentration: See which sectors the fund is most invested in at a glance through proportional horizontal bars.
- Portfolio Diversification: Understand how diversified the fund's portfolio is across different sectors.
- Investment Strategy: Identify if the fund is sector-agnostic or has a focused sectoral mandate based on the distribution of investments.
Key features of the Sectors tab:
- Horizontal Bar Chart: Each sector is displayed with a bar proportional to the number of active portfolio companies in that sector.
- Sector Labels: Sector names are displayed on the left for easy scanning.
- Company Count: The exact number of active portfolio companies is displayed next to each bar.
- Total Count: A badge at the top shows the total number of active Indian portfolio companies represented in the chart.
- Active Companies Only: Only active (not exited, not inactive) Indian portfolio companies are included in the sector breakdown.
What does the "Compare Portfolio with Peers" tab show and how can I use it?
This tab compares the fund's sector allocation against an aggregate peer group (funds with similar stage, ticket size, and geography). It's useful for understanding:
- Sector Allocation Comparison: A side-by-side view of the fund's portfolio composition vs the peer group average. The peer group will almost always appear less concentrated than the fund, but you can track commonality in the top sectors.
- Contrarian Indicator: Highlights where the fund over-indexes or under-indexes compared to peers. This helps identify if a fund follows a conformist or a contrarian strategy.
- Investment Timeline: Stacked bar charts showing the number of new companies invested in each year, broken down by sector — both for the fund and its peer group. The timeline tracks only new portfolio company additions (not follow-ons) and is a good indicator of portfolio expansion velocity. It can also highlight sectoral deal frenzies or hype cycles.
Sectors with ≤3% in the peer group are grouped as "Others" and can be expanded to see individual sub-sectors.
What is the difference between Investment Stages and Rounds (Ticket Sizes)?
Investment Stages give you a sense of the nature of funding (Seed, Early, Growth, Late), while Rounds (such as Series A, Series C, Series E, etc.) provide incremental detail. Stages and Rounds are particularly useful for VC funds, as the letter-based round nomenclature may not be intuitive enough for everyone to understand the funding nature (early, growth, etc.).
The Round & Ticket Sizes section shows the typical investment amount per deal for each stage/round, displayed as ranges (e.g., $5-10mn).
How are portfolio companies listed and can I filter/sort them?
The Portfolio tab lists Indian companies the fund has invested in. For global funds, a notice clarifies that only Indian portfolio companies are shown. Data is primarily sourced from the disclosed portfolio on fund websites and from news (for recently announced investments which may not yet be updated on fund websites).
Table Columns:
- Company: The name of the portfolio company. Clicking on the company name will take you to its detailed page.
- Sector: The primary industry sector of the company.
- Investment Date: The first reported date of investment by the fund into the company.
- Status: Denotes if the company is currently in the fund's portfolio (Active), or exited (Exited) or gone defunct (Inactive).
- Website: Link to the company's official website.
You can sort by any column and filter by Sector or Status. Foreign portfolio companies are not shown as they're beyond the current scope of The India Portfolio.
What does the "Portfolio Ecosystem" (Common Investors) tab show?
This tab visualizes the fund's investment network by showing other funds that have co-invested in the same portfolio companies. It's organized as a Kanban board with three columns:
- Invested Before: Funds that invested into the common portfolio companies before your fund did
- Same Stage (Syndicates): Funds that invested in or around the same time/round as your fund
- Invested After: Funds that invested after your fund did
Each co-investor card shows:
- Fund name (clickable to view the fund's profile)
- Fund type and stage
- Number of shared portfolio companies
- List of common portfolio companies (clickable to view each company's profile)
You can filter co-investors by Sector or Investment Year of the common portfolio companies. Investment year denotes when the co-investor first invested in the common portfolio company.
Important Note: Funds in the "Invested Before" or "Invested After" categories do not represent entry or exit paths of the selected fund into the common portfolio company. The feature only depicts the chronology of which fund invested before, after, or alongside the selected fund.
This feature considers only active portfolio companies of both the selected fund and overlapping funds.
How do I download fund data?
Click the Download button in the top-right corner to choose from three formats:
- .MD (Markdown): A clean, readable text format with all fund data, including the sector breakdown as Section II.
- .JSON: Structured machine-readable format for developers, with sector breakdown as a top-level field.
- .PDF: Print-ready document (opens in a new window for printing) with the sector breakdown as Section II.
Downloads include all relevant fund information, sector breakdown, portfolio companies, peer comparison data, portfolio ecosystem data, and investment timelines — tailored to the fund type (equity vs non-equity).
What are the limitations of the data on this page?
- Given the dependence on fund websites and news for sourcing portfolio company names, investment dates, status (Active/Exited/Inactive), etc., any limitations or inaccuracies in the source might flow through to the data on this page. We strive to ensure accuracy and comprehensiveness of portfolio company data to the best of our abilities.
- The Sector Breakdown tab only includes active Indian portfolio companies. Exited, inactive, and foreign portfolio companies are excluded.
- The timeline feature only counts investments into new companies, not follow-ons into existing portfolio companies.
- The Portfolio Ecosystem feature only considers active portfolio companies.
- Chronology in the Ecosystem tab represents investment order, not entry/exit paths.
I have more questions or comments. What can I do?
You can reach out to us at [email protected] and we'll be happy to help.