Help: Fund Portfolio Comparison vs Peers Page
Portfolio vs Peers Feature:
This feature is designed to help you compare the sectoral composition of a fund's portfolio with that of its peers. You can understand a fund's sectoral preferences for investments, sector concentration, variations vs. peers, contrarian styles, etc. Peers of a fund include those funds which invest in similar stages, ticket sizes, etc.
Timeline Feature:
In addition you can also see a yearly timeline (current year and 3 previous calendar years) showing count of new companies that the fund invested in. Note this is only count of new companies added to the fund's portfolio, hence it does not consider follow ons in existing portfolio companies, exits from the portfolio, etc. This timeline feature is a good indicator of portfolio expanson velocity.
Illustration:
Let's understand this feature using an example - here is the Portfolio Comparison for Creador
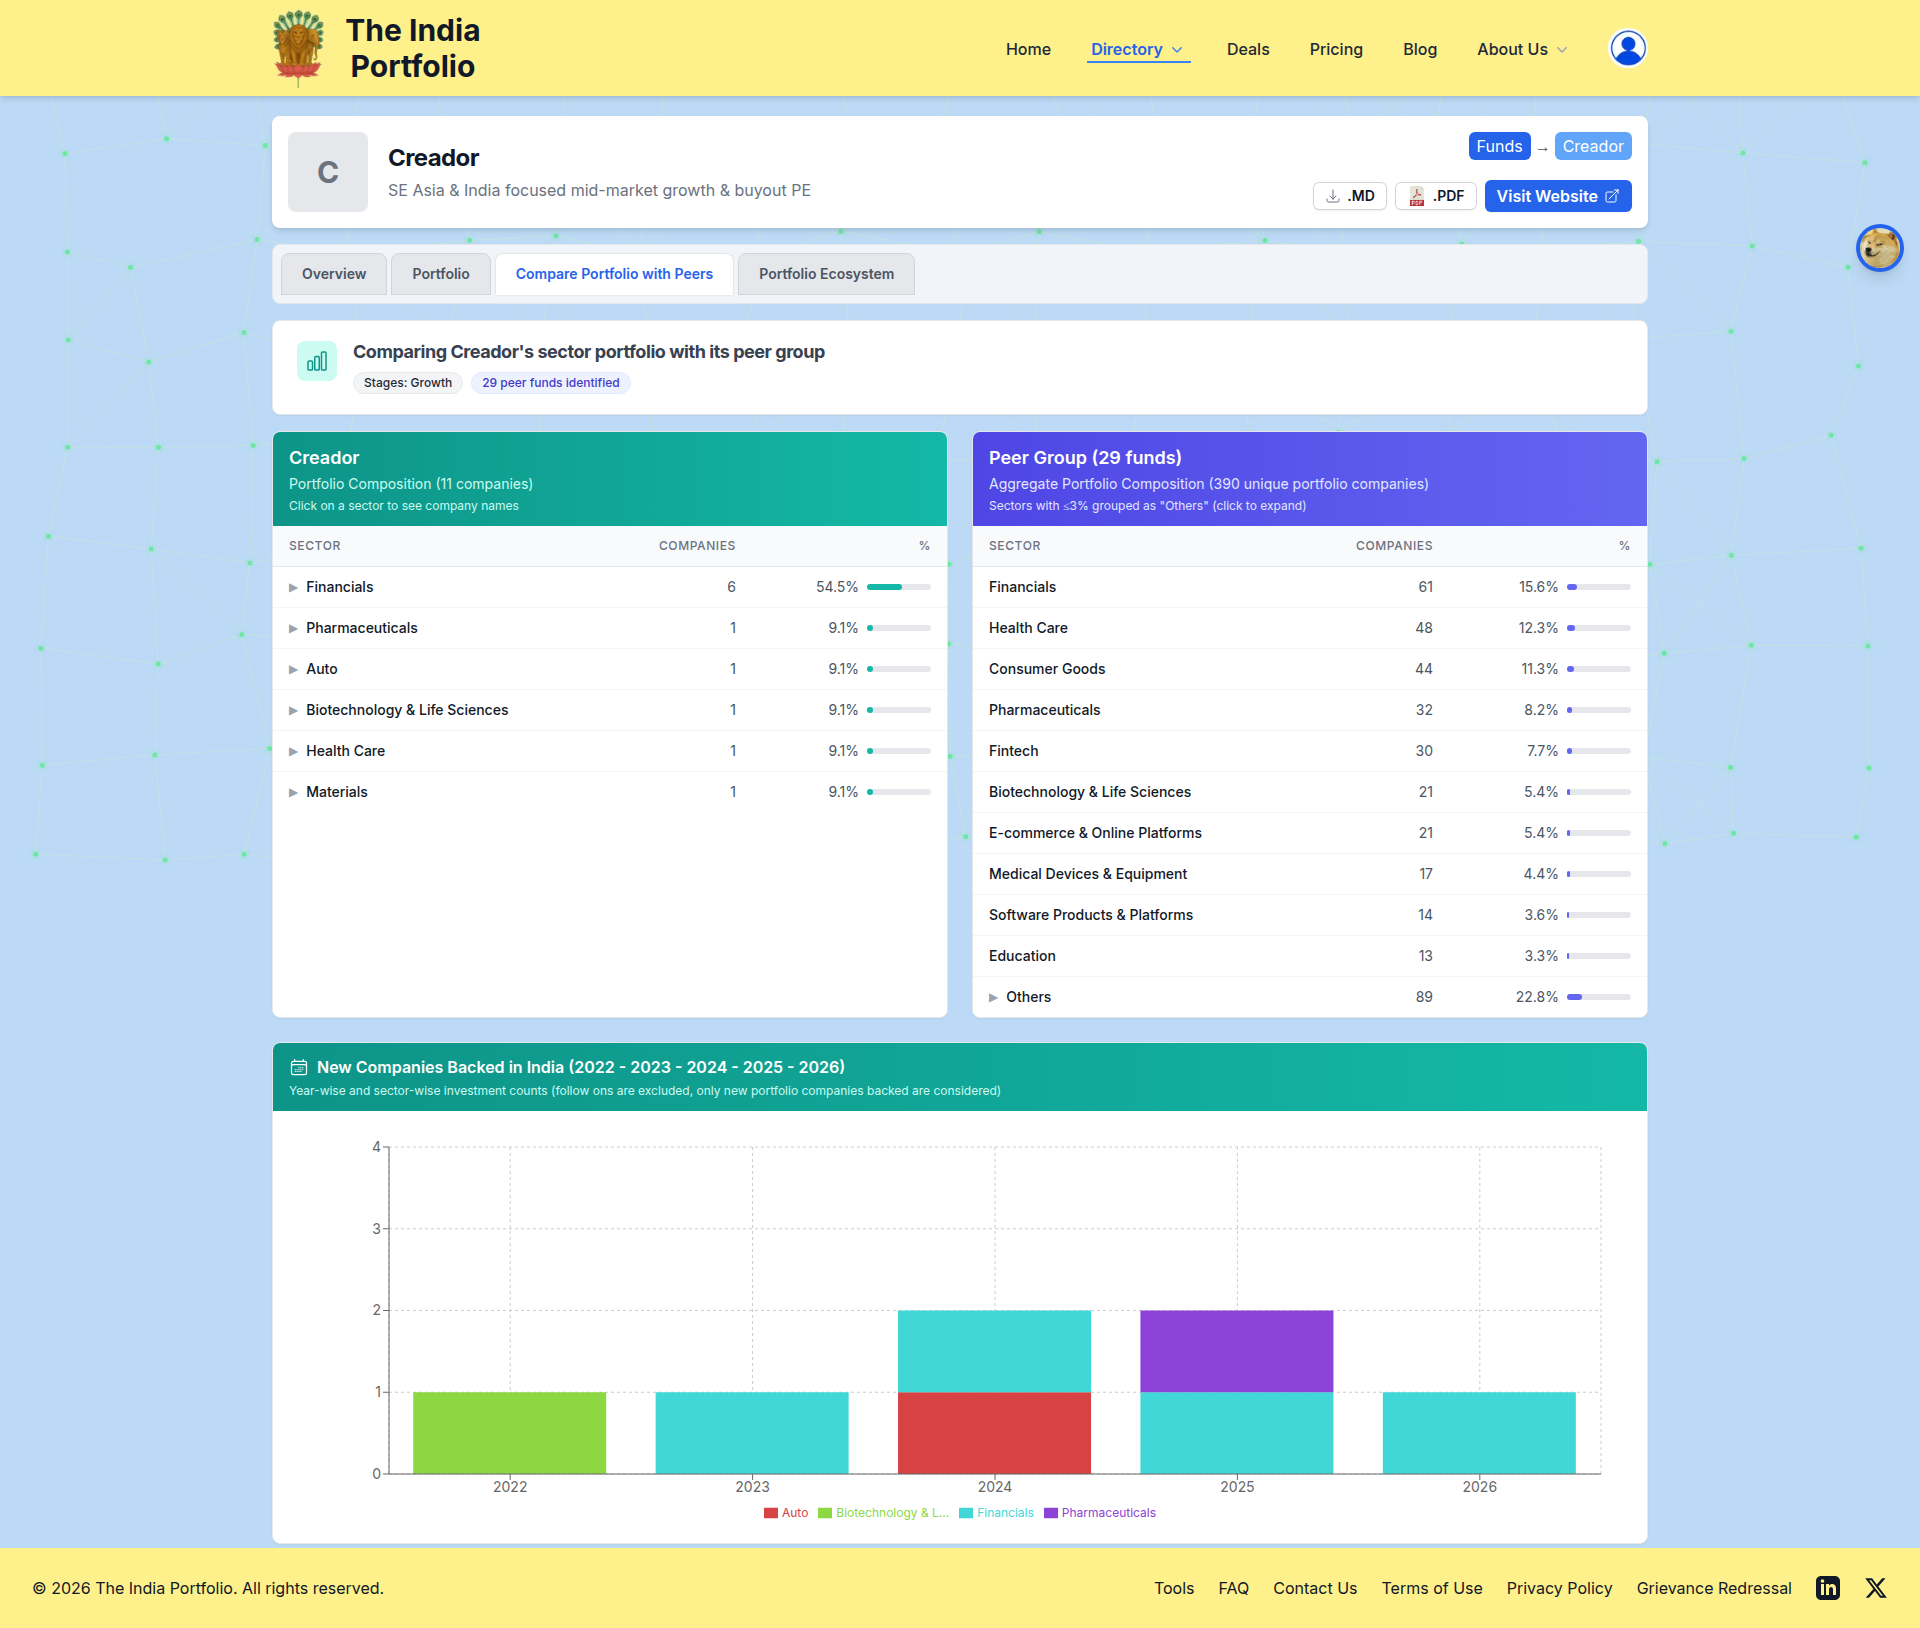
As you can see, Creador has 11 portfolio companies (as of Mar 2026), spread across 6 sectors. Concentration is pronounced, with 6 of their 11 portfolio companies belonging to the Financials sector (they have a special affinity for NBFCs!).
Now consider the sectoral spread of Creador's peer funds - essentially other Growth stage Private Equity funds. Peer funds too have Financials as their top sector. Comparison of percentage values of exposure to sectors may not be very useful as the peerset will almost always appear less concentrated than the fund. But it can be very useful to track commonality in the top-n sectors of the fund vs. its peerset. In the case of Creador, of its 6 sectors, 4 sectors (namely Financials, Pharmaceuticals, Biotechnology & Life Sciences and Health Care) also show up in the top-10 invested sectors in the peerset. You can say that Creador's strategy is broadly inline with its peers. Nothing contrarian here.
Moving to Creador's timeline, they have invested into 7 new companies over CY2022 - 3mCY2026, adding 1 - 2 new portfolio companies every year. Also note the sector activity across the years - they have kept up their new investment activity into the Financials sector with 1 new company backed in each year of the timeline barring CY2022. The timeline feature can also be used to point out sectoral deal frenzies/hype cycles (which we dont see in Creador's deal activity).
Points to Note & Limitations:
- The timeline feature only counts investments into new companies, not follow ons into existing portfolio companies
- Given the dependence on funds' websites and news for sourcing names of portfolio companies, investment dates, etc. any limitations or inaccuracies in the source might flow through into the data on this page. We try to ensure accuracy and comprehensiveness of portfolio company data, to the best of our abilities.
If you have further questions about this feature, please contact us