Building The India Portfolio #12 - Now Compare Portfolios Of Any Two Funds
Here comes our Fund Portfolio Comparison tool - a powerful new feature that allows you to compare the portfolio and investment activity of any two funds across years, sectors and even investment vehicles.
While our existing Portfolio Comparison tab (introduced in Building The India Portfolio #11) compares a fund against its peer group, this new standalone tool gives you complete flexibility to choose any two funds for a detailed side-by-side comparison.
Why Compare Any Two Funds?
The ability to compare any two funds unlocks a new dimension of analysis:
Direct Fund Benchmarking: Want to see how a specific VC fund's sector allocation compares to a particular PE fund? Or compare two competing funds in the same space? Now you can, directly.
Sector & Year-Level Granularity: The comparison matrix shows you exactly where each fund has invested - by sector, by year and even by specific investment vehicle (Fund I, Fund II, etc.).
Common Portfolio Discovery: See which companies both funds have invested in and whether they invested in the same year or different years. This is invaluable for understanding co-investment patterns and competitive dynamics.
Investment Vehicle-Level Analysis: Drill down to see how each fund's individual vehicles (e.g., "Fund III") have performed across sectors and years, helping you understand the evolution of a fund's strategy over time.
Understanding Through Illustration
Let's look at a real-world example comparing Kedaara Capital vs ChrysCapital.
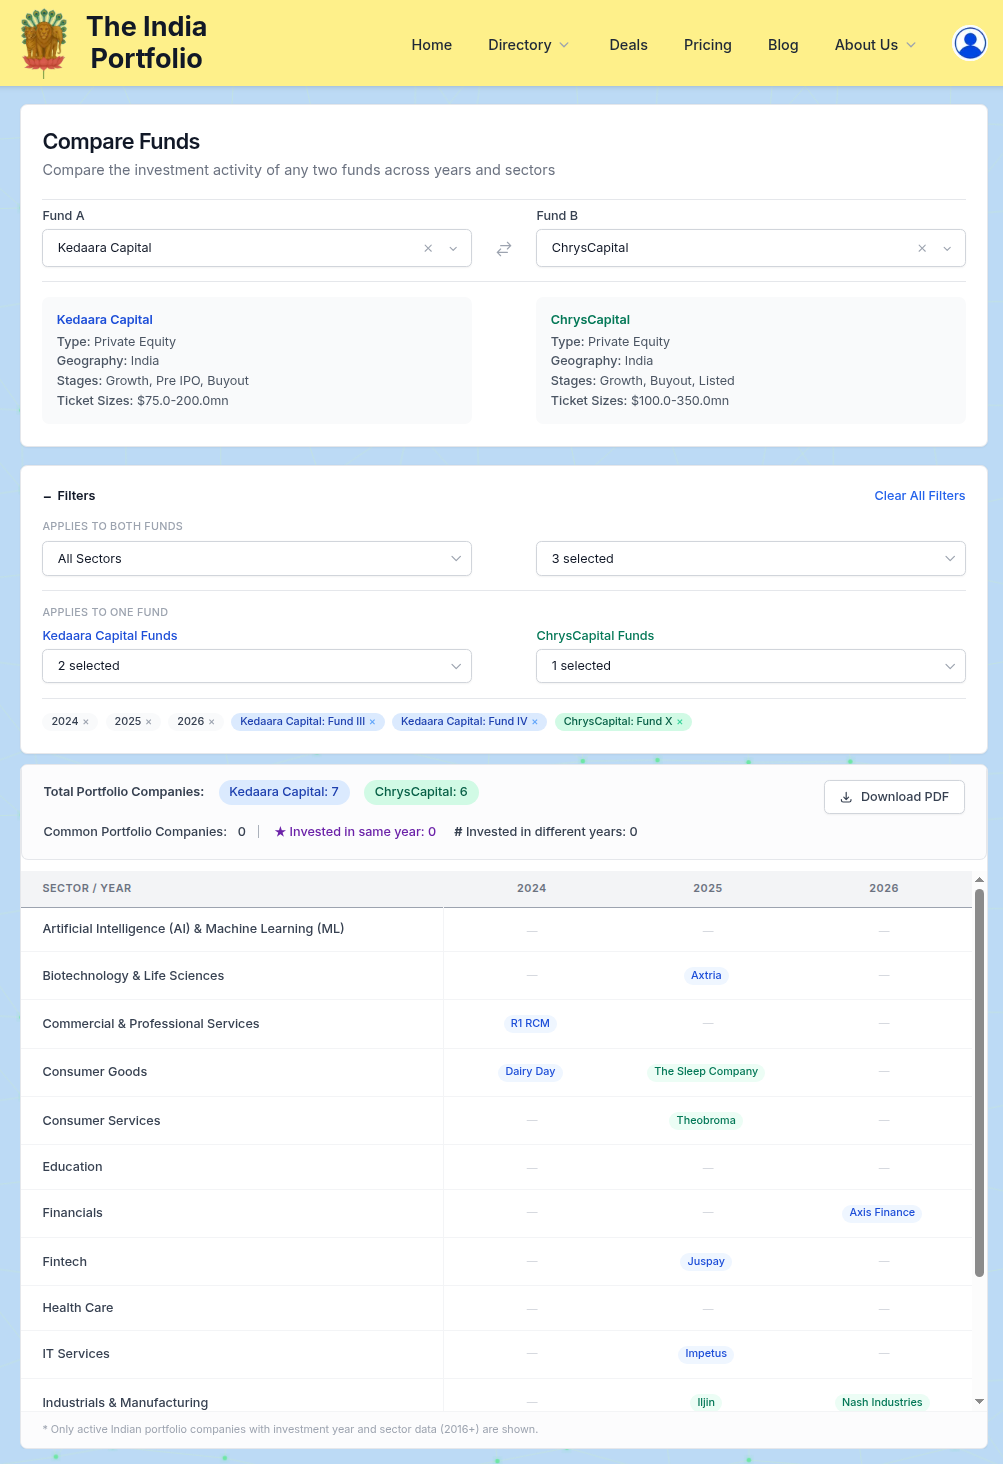
As you can see, the comparison matrix organizes portfolio companies by Sector (rows) and Investment Year (columns). Each company badge is color-coded to show which fund invested:
- Blue badge - Company invested only by Fund A (Kedaara Capital)
- Blue badge - Company invested only by Fund A (Kedaara Capital)
- Green badge - Company invested only by Fund B (ChrysCapital)
- ★ Purple badge - Both funds invested into the Company in the same year
- # Blue/Green badge - The # in front indicates that the Company was backed by both funds but in different years
The summary stats at the top give you an instant snapshot:
- Total Portfolio Companies - Active Indian portfolio companies for each fund
- Common Portfolio Companies - Companies where both funds have invested
- ★ Same Year - Common companies where both funds invested in the same year
- # Different Years - Common companies where the funds invested in different years
Powerful Filtering Capabilities
The Fund Comparison tool comes with robust filtering options:
Applies to Both Funds:
- Sectors: Filter by specific sectors to see how each fund invests in a particular industry
- Years: Filter by investment year to see recent activity or historical trends
Applies to One Fund:
- Investment Vehicles: Each fund has its own dropdown showing the distinct investment vehicles (e.g., "Fund I", "Fund II", "Fund III") used by that fund
- Select one or more vehicles to see only portfolio companies invested through those specific vehicles
- For example, selecting "Fund III" for Kedaara Capital will show only companies invested through Kedaara's Fund III
- This is useful for understanding the evolution of a fund's investment strategy across different vehicles
You can also Download a PDF of the comparison matrix, which includes:
- Fund details (type, geography, stages, ticket sizes)
- Portfolio company counts and common companies
- The full comparison matrix with all applied filters
Investment Vehicle-Level Analysis
One of the most powerful aspects of this tool is the ability to analyze how each fund's different vehicles invest across sectors and years.
Consider a fund like Kedaara Capital, which has multiple funds (Fund I, Fund II, Fund III, etc.). By filtering on a specific vehicle, you can see:
- Which sectors each vehicle focused on
- How the investment strategy evolved across funds
- Whether later funds followed the same sector thesis or pivoted
This level of granularity is invaluable for LPs conducting due diligence, GPs benchmarking against peers and anyone tracking the evolution of investment strategies in the Indian market.
How This Differs From Portfolio Comparison
It's worth noting the distinction between these two complementary features:
| Feature | Portfolio Comparison Tab (in Fund Details) | Portfolio Comparison Tool |
|---|---|---|
| What it compares | Fund vs its peer group | Any two funds of your choice |
| Where to find it | Within a fund's detail page | Standalone analytics page |
| Use case | Understand if a fund is contrarian or conformist | Directly benchmark any two funds |
| Granularity | Sector-level allocation vs peers | Sector + Year + Vehicle-level comparison |
In essence, the Compare Portfolio with Peers tab helps you understand a fund's strategy only in the context of its peers, while the Fund Portfolio Comparison Analytics tool serves a much larger purpose and allows you to compare any two funds of your choice.
Points to Note & Limitations
- Only active portfolio companies are shown (exited companies are excluded)
- Only Indian portfolio companies are included
- Only companies with investment year 2016 or later are displayed
- Investment vehicle data availability depends on the source data — some funds may have all vehicles marked as "n.a." (non-actual)
- When a company has multiple vehicles invested (e.g., "Fund II, Fund III"), selecting either vehicle will include that company in the filtered view
- Given the dependence on funds' websites and news for sourcing portfolio company data, any limitations or inaccuracies in the source might flow through into the data
The Deal-Making Platform for the AI Era
The India Portfolio is constantly upgrading itself. We are regularly thinking through and putting together the pieces of the data and deals layers to build out India's finest deal making platform.
Sign In today and start using the Directory that is meant for Deal making.